
Dog Age Chart: Five Clear Worked Examples
A dog age chart is easiest to interpret when every row comes from a visible method. PawAgeCalc’s table is an original illustration, not a clinical chart or an individual lifespan forecast. This collection follows five fictional examples: a medium adult, four size assumptions, an age between birthdays, a puppy calendar note and an older-dog illustration. Each example keeps chronological age separate from human-year language and leaves veterinary assessment outside the calculation.
Example one: five years with a medium assumption
Enter five completed years, zero additional months and Medium. The model starts from twenty-four illustrative human years at dog age two. It then adds five for each of the three years beyond two. The arithmetic is 24 plus 5 times 3, which equals 39. The chronological result remains five years, zero months regardless of the comparison.
The selected-size chart follows the same rule. At dog age three it shows 29, at four it shows 34 and at five it shows 39. The sequence makes the slope visible. It should not be read as a schedule of clinical changes occurring on successive birthdays, and the model does not supply a corresponding treatment or care recommendation.
Use this example to check an entry manually before copying. If the result is 44, the age or input group may differ from the stated example. If another website gives a different figure, compare its formula rather than assuming the chronological record is wrong. A difference in model can produce a difference in comparison without changing the original age.
Example two: eight years across four groups
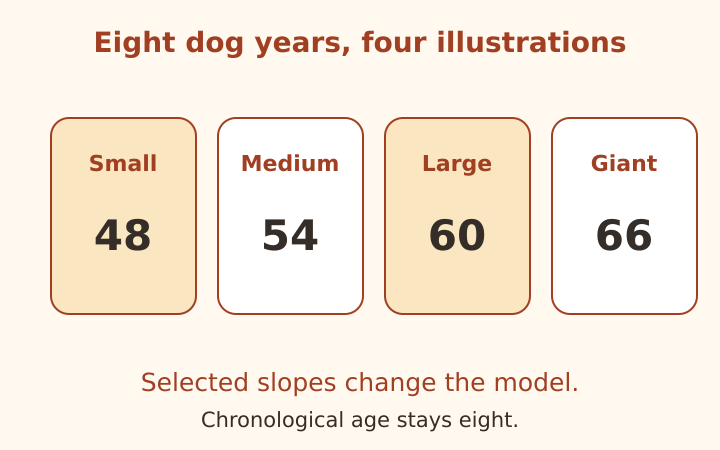
Keep dog age at eight and compare Small, Medium, Large and Giant. Six years have passed after the model’s two-year starting point. Small gives 24 plus 4 times 6, or 48. Medium gives 24 plus 5 times 6, or 54. Large gives 60, and Giant gives 66 under their slopes of six and seven.
The calculator displays these alternatives together for ages of at least one year. The comparison illustrates how the chosen slope affects the result. It is not a set of breed-specific predictions or a validated range for a particular animal. The size labels describe this site’s model groups and cannot substitute for an individual veterinary assessment.
A boundary comparison is still only a scenario
Suppose an adult-size expectation sits near the medium/large boundary. Comparing 54 and 60 at age eight can show the effect of selecting either group. It does not measure which value is biologically correct. Preserve the uncertainty about the group and keep the actual chronological age as the primary information.
Example three: five years and six months
In manual mode, five completed years and six additional months becomes 5.5 years because the tool divides months by twelve. The medium illustration is 24 plus 5 times 3.5, giving 41.5. Small gives 38, Large 45 and Giant 48.5. These decimals express the arithmetic of the chosen model, not biological precision to half a human year.
Date mode can produce a slightly different fractional age between birthdays because it uses actual elapsed days within the current birthday interval. Manual half a year and a particular six-calendar-month interval are different conventions. At a complete birthday, both routes align when they describe the same age; between birthdays the basis should stay visible.
Do not change an estimated birthday merely to make a rounded result match the manual entry. Preserve the information you actually have. A detailed output should not drive the record backward into an invented date. If the input is approximate, copy that qualifier with the note and avoid presenting the comparison as more certain than its source.
Example four: a six-month puppy calendar note
Use a fictional birth date of April 12, 2026 and a reference date of October 12, 2026. The calculator reports zero years, six months and zero remaining days. It also gives the elapsed calendar-day count. Those are chronological representations of the same date interval under the tool’s calendar convention.
Because the age is under one year, the human-year field says Not shown. The adult-size comparison is also hidden for the current result. This is intentional: the site does not turn every puppy age into a precise human-infant comparison. The expandable whole-year chart remains an illustration of the selected model from age one onward, not a forecast of this puppy’s development.
The AAHA discussion of defining senior patients illustrates that veterinary age context has its own individual considerations. It is not the basis of a six-month human-year conversion here. PawAgeCalc does not assign clinical stages from its display boundary or extrapolate a puppy’s future lifespan.
Example five: twelve years and later extrapolation
At twelve dog years, ten years lie beyond the model’s two-year point. Small gives 64, Medium 74, Large 84 and Giant 94. These values come directly from 24 plus the selected slope times ten. Their numerical spread reflects the model choices; it does not quantify health differences among four actual dogs.
If you enter seventeen years with Medium, the arithmetic gives 99, but the page labels it as mathematical extrapolation beyond the displayed chart’s one-to-sixteen-year range. The software permits ages through thirty years to accommodate records and edge cases, not because the illustration is validated across that entire range. A high comparison number should not be presented as a clinical finding.
The calculator does not subtract twelve, seventeen or any other age from an assumed breed lifespan. A human-year chart and dog life expectancy by breed are different subjects. Keep population longevity information in its research context rather than inventing a remaining-years countdown for an individual. That boundary is especially important when an older dog’s result is shared with someone who might read it as a prognosis.
Make the chart reproducible without making it authoritative
The comparison of age-conversion methods explains why a seven-times rule or a research translation can differ from this illustration. A transparent chart should state its starting points, slopes and interpolation. Reproducibility means another reader can perform the same arithmetic; it does not establish clinical validity.
Use the dog age calculator and illustrative chart to reproduce these examples, then replace them with your own age basis and clearly identified adult-size assumption. Check the entry mode, month components and reference date before copying. If an active field becomes invalid, the previous result and chart are hidden until the issue is corrected.
A useful saved note gives chronological age first, then the optional comparison, formula and limits. It also identifies an estimated birthday when relevant. The result is informational only, not veterinary advice, a health assessment or a lifespan prediction. The chart serves best as a clear explanation of one model, while individual care questions remain with your veterinary team.
Frequently asked questions
Is the chart an official veterinary table?
No. It is original arithmetic from this site’s chosen model and slopes, explicitly labeled illustrative.
What happens above sixteen dog years?
The software still calculates through thirty years, but labels results above sixteen as mathematical extrapolation. This is not a validated clinical range or lifespan forecast.
Keep age and assumptions together
Open the dog age calculator to make an age note with the entry method and adult-size assumption visible. The human-year comparison is illustrative only, not veterinary advice, a health assessment or a prediction of remaining lifespan.
More notes from the setup desk
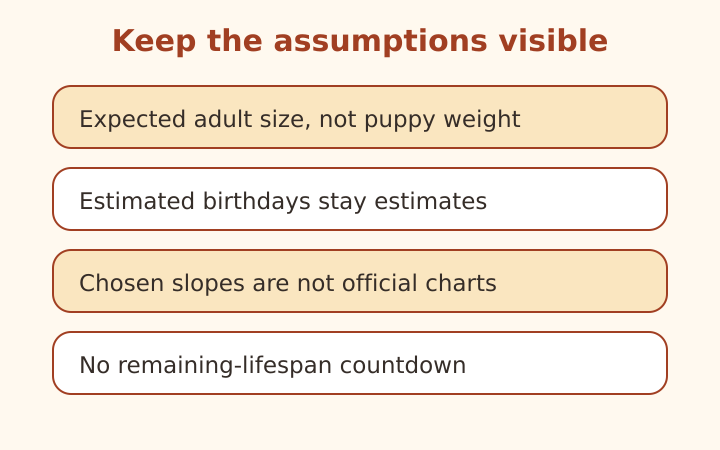
Dog Age by Breed and Size: Mistakes to Avoid
Check adult-size assumptions, estimated birthdays and chart claims. Learn why breed longevity statistics are not individual countdowns.
Read the note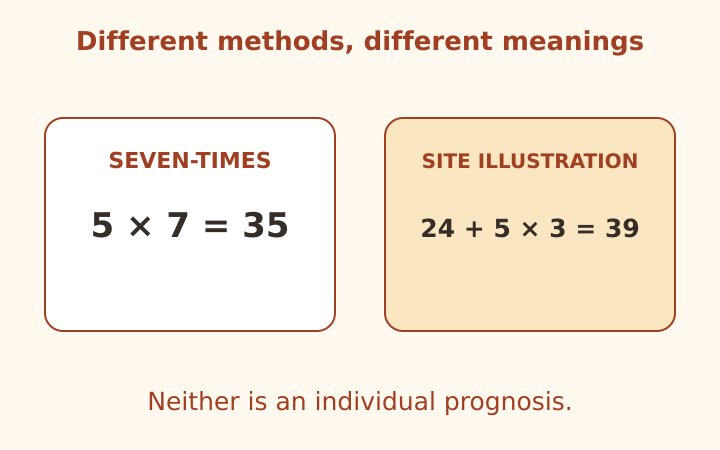
Dog Years to Human Years: Methods Compared
Compare the seven-times rule, a staged illustration and research context while keeping chronological age separate from prognosis.
Read the note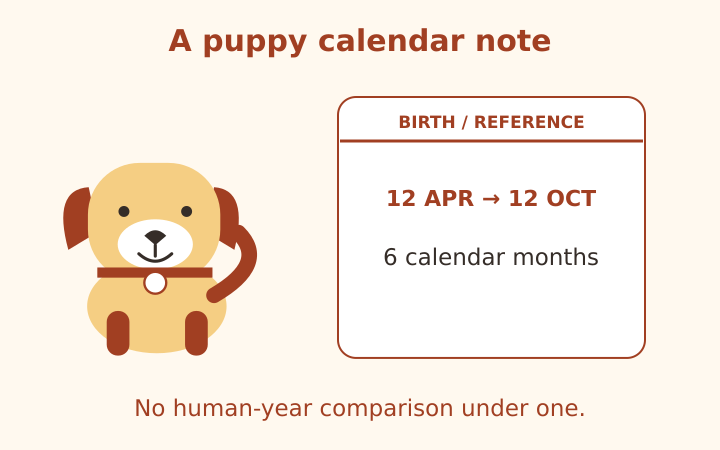
Puppy Age Calculator: Calendar Age Explained
Understand puppy calendar age, estimated birthdays, weeks versus months and leap-day conventions without a human-age assessment.
Read the note